Quick Start Guide
The Community Analysis Pipeline (CAP) is a Python-based command-line tool that performs analysis and creates plots from netCDF files output by the Mars Global Climate Model (MGCM).
Available Commands
Below is a list of the executables in CAP. Use this list to find the executable that performs the operation you desire.
MarsCalendar - Converts Ls into day-of-year (sol) and vice versa.
MarsFiles - Manipulates entire files (e.g., time-shift, regrid, filter, etc.)
MarsFormat - Transforms non-MGCM model output for compatibility with CAP.
MarsInterp - Interpolates files to pressure or altitude coordinates.
MarsPlot - Generates plots from Custom.in template files.
MarsPull - Queries data from the MGCM repository at data.nas.nasa.gov/mcmc
MarsVars - Performs variable manipulations (e.g., deriving secondary variables, column-integration, etc.)
Example Usage
Let’s walk through a simple use case for CAP. We will install CAP, source the virtual environment, download two files from the NAS Data Portal, inspect the file contents, derive a secondary variable and add it to a file, and finally generate two plots.
1. Install CAP
Install CAP using the instructions provided here. Once installed, make sure you have sourced your virtual environment. Assuming the virtual environment is called amescap, activate it like so:
source amescap/bin/activate.csh # For CSH/TCSH
# OR
source amescap/bin/activate # For BASH
In your virtual environment, you may type cap at any time to review basic usage information. You can also check your CAP version and install date using cap version or cap info, which returns:
CAP Installation Information
----------------------------
Version: 0.3
Install Date: Fri Mar  7 11:56:48 2025
Install Location: /Users/path/to/amescap/lib/python3.11/site-packages
2. Retrieve netCDF data
Begin by using MarsPull to retrieve MGCM data from the NAS Data Portal.
If you check out the website at the link above, click “Reference Mars Climate Simulations” and then “FV3-based Mars GCM,” you’ll see a list of files. We will download the one called 03340.atmos_average_pstd.nc and its associated “fixed” file, 03340.fixed.nc:
MarsPull FV3BETAOUT1 -f 03340.atmos_average_pstd.nc 03340.fixed.nc
Note
The download will take a few minutes. Actual time varies depending on your internet download speed.
While we wait for the download, let’s explore how we would know to use this exact command. The Available Commands section above lists the executables and their functions (you can also view this in the terminal by typing cap). This list tells us that we want to use MarsPull to retrieve data, and that we can use [-h --help] to view the instructions on how to use MarsPull, like so:
MarsPull -h
which outputs:
usage: MarsPull [-h] [-list] [-f FILENAME [FILENAME ...]] [-ls LS [LS ...]] [--debug]
               [{FV3BETAOUT1,ACTIVECLDS,INERTCLDS,NEWBASE_ACTIVECLDS,ACTIVECLDS_NCDF}]

Uility for downloading NASA Ames Mars Global Climate Model output files from the NAS Data Portal at:https://data.nas.nasa.gov/mcmcref/

Requires the ``-id`` argument AND EITHER ``-f`` or ``-ls``.

positional arguments:
{FV3BETAOUT1,ACTIVECLDS,INERTCLDS,NEWBASE_ACTIVECLDS,ACTIVECLDS_NCDF}
                        Selects the simulation directory from the NAS data portal:
                        https://data.nas.nasa.gov/mcmcref/

                        Current options are:
                        FV3BETAOUT1
                        ACTIVECLDS
                        INERTCLDS
                        NEWBASE_ACTIVECLDS
                        ACTIVECLDS_NCDF
                        MUST be used with either ``-f`` or ``-ls``.
                        Example:
                        > MarsPull ACTIVECLDS -f fort.11_0730
                        OR
                        > MarsPull ACTIVECLDS -ls 90


options:
-h, --help            show this help message and exit
-list, --list_files   Return a list of all the files available for download from:
                        https://data.nas.nasa.gov/mcmcref/

                        Example:
                        > MarsPull -list

-f FILENAME [FILENAME ...], --filename FILENAME [FILENAME ...]
                        The name(s) of the file(s) to download.
                        Example:
                        > MarsPull ACTIVECLDS -f fort.11_0730 fort.11_0731

-ls LS [LS ...], --ls LS [LS ...]
                        Selects the file(s) to download based on a range of solar longitudes (Ls).
                        This only works on data in the ACTIVECLDS and INERTCLDS folders.
                        Example:
                        > MarsPull ACTIVECLDS -ls 90
                        > MarsPull ACTIVECLDS -ls 180 360

--debug               Use with any other argument to pass all Python errors and
                        status messages to the screen when running CAP.
                        Example:
                        > MarsPull ACTIVECLDS -ls 90 --debug
As we can see, MarsPull wants us to provide the simulation directory name and either one or multiple file names or an Ls range. The directory name isn’t very obvious, but it is listed at the end of the URL on the webpage we looked at earlier: https://data.nas.nasa.gov/mcmcref/fv3betaout1/.
Then, we used the [-f --filename] argument to specify which files from that page we wanted to download.
3. Inspect the file contents
Once our files are downloaded, we can look at the variables they contain using the “inspect” function in MarsPlot. This is one function you’ll want to remember because you’ll find its always useful.
MarsPlot -i 003340.atmos_average_pstd.nc
The following should be printed to your terminal:
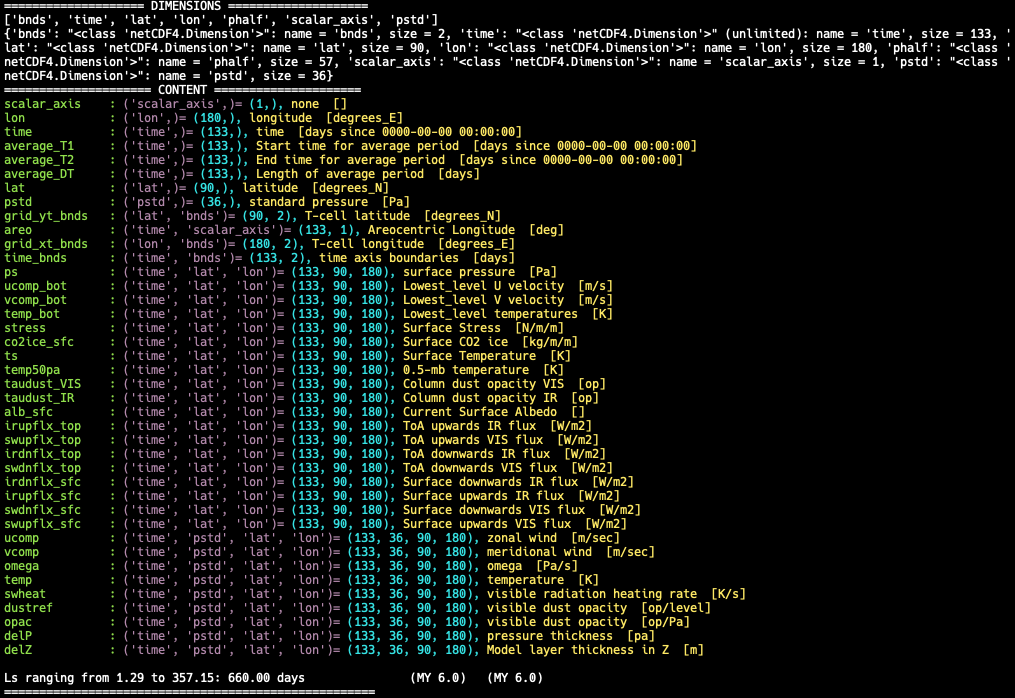
We can see dozens of variables in the file including surface pressure (ps) and atmospheric temperature (temp). We can use these variables to derive the CO2 condensation temperature (Tco2). Let’s derive that variable and add it to the file.
4. Derive and add Tco2 to the file
Calling [-h --help] on MarsVars will return a list of variables that MarsVars can derive for you. Make sure your netCDF file has the variables required to derive your requested variable first. To add Tco2 to our file, we type:
MarsVars 003340.atmos_average_pstd.nc -add Tco2
When that completes, we can inspect the file to confirm that Tco2 was added:
MarsPlot -i 003340.atmos_average_pstd.nc
You should see a new variable listed at the bottom of the printed output:
Tco2: ('time', 'pstd', 'lat', 'lon')= (133, 36, 90, 180), CO2 condensation temperature (derived w/CAP) [K]
Next, let’s create some plots.
5. Generate some plots
CAP’s plotting executable is MarsPlot, which accepts a template file called Custom.in from which it generates plots. First we need to make this template file, so we type:
MarsPlot -template
This creates Custom.in in your current directory. Open Custom.in in your preferred text editor. You can set the syntax highlighting scheme to detect Python in order to make the file more readable.
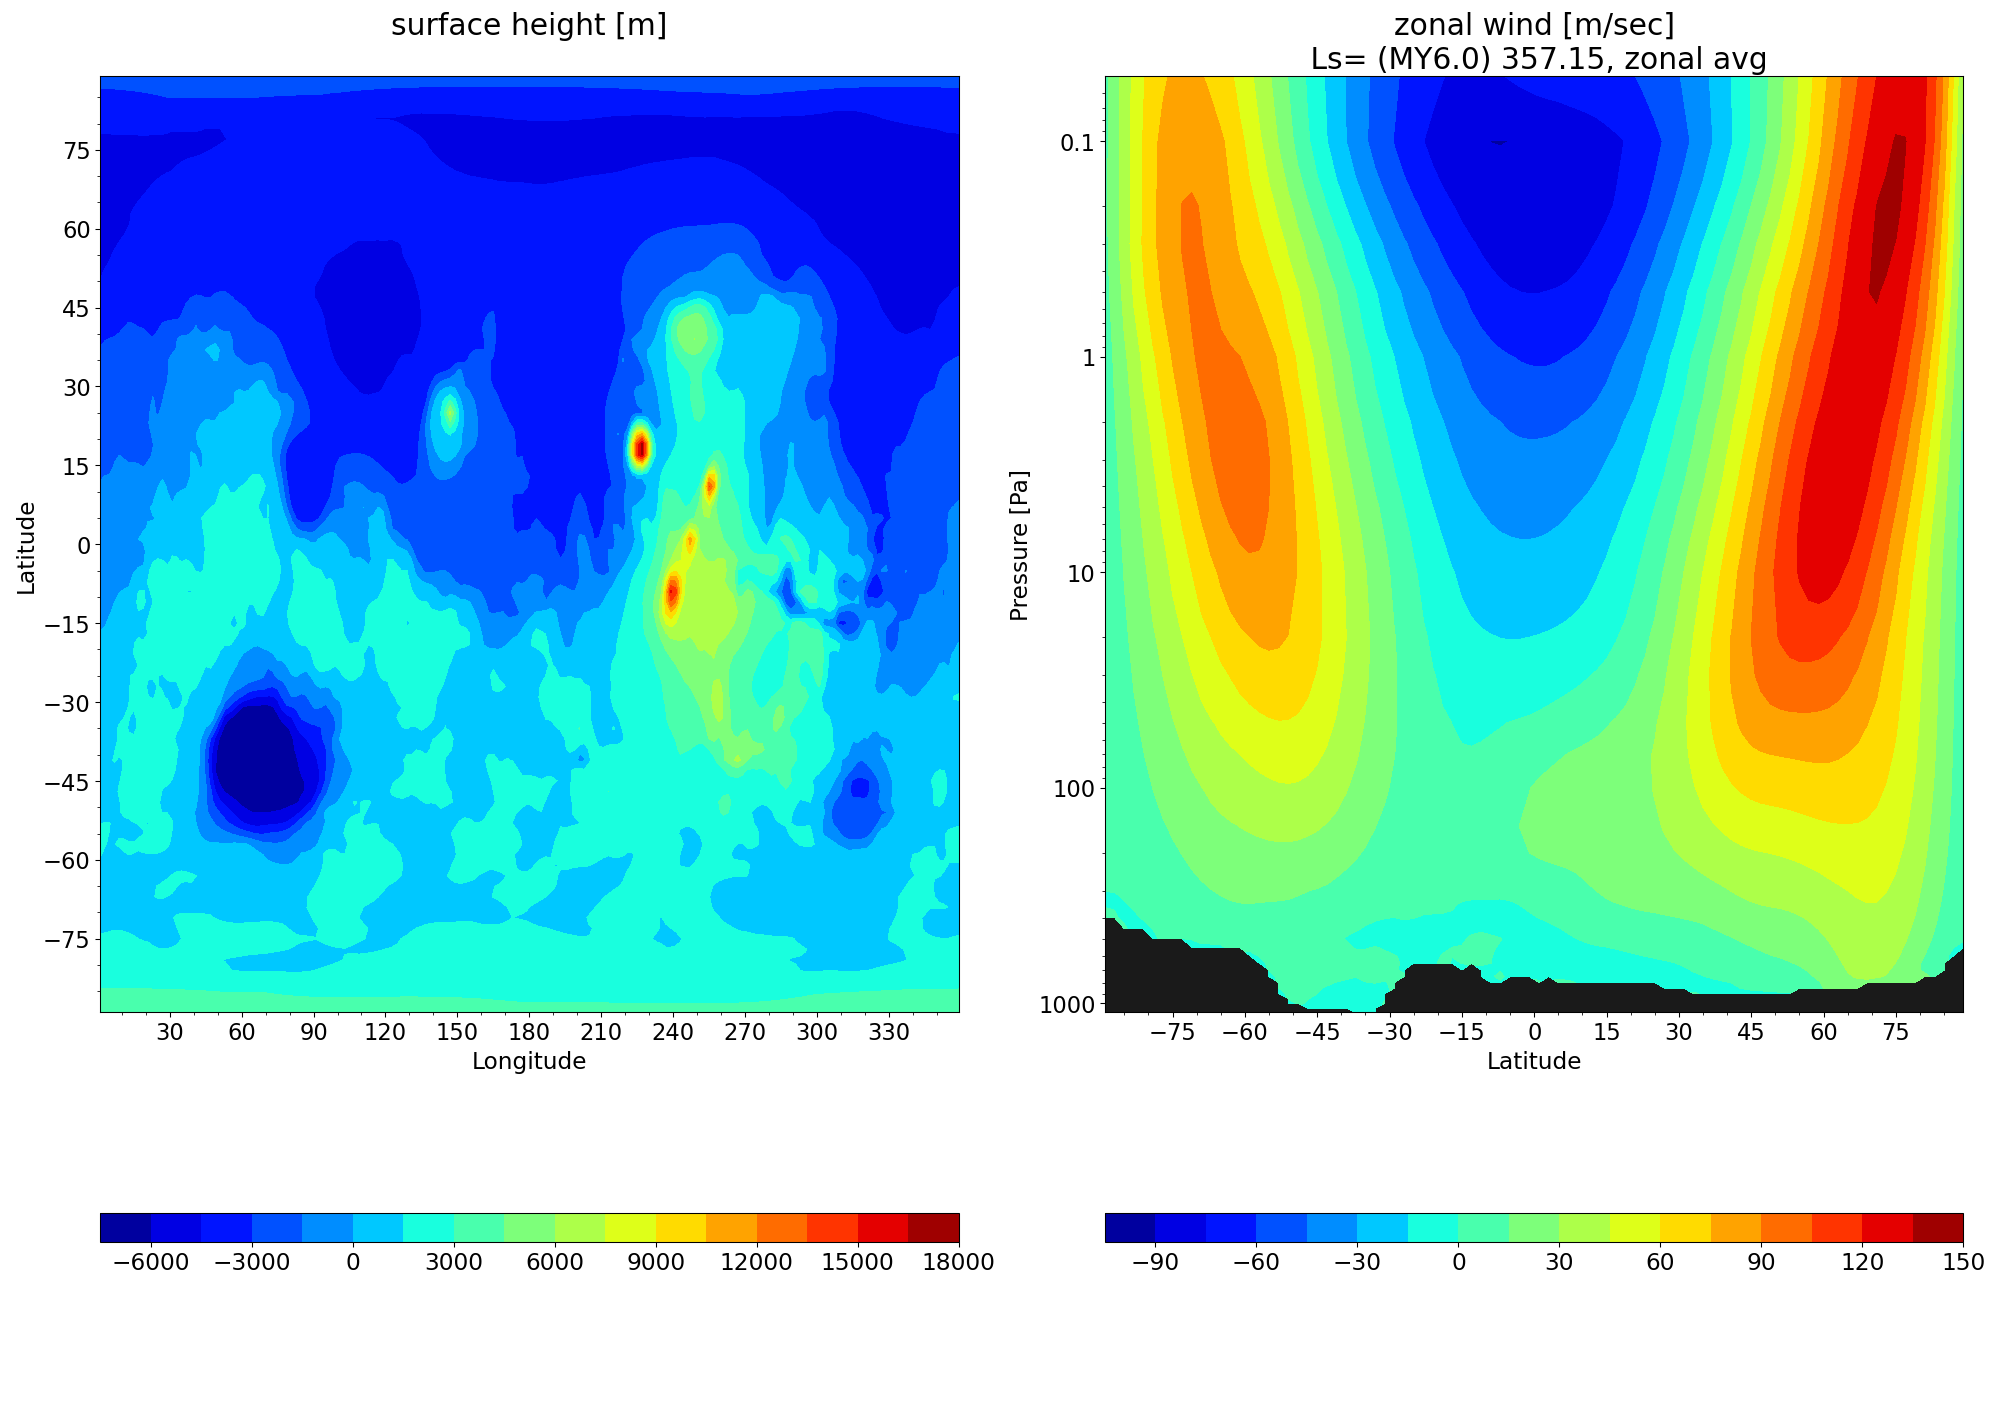
The template file contains templates for several plot types. Scroll down until you see the first two templates, which are set to True by default. The default settings create a topographical map from the zsurf variable in a fixed file and a latitude-level cross-section of the zonal wind (ucomp) from an atmos_average file. Since our atmos_average file has been pressure interpolated, let’s append _pstd to the file name in Custom.in. Your Custom.in file should look like this:

Save your changes to Custom.in and pass it into MarsPlot to generate the figures:
MarsPlot Custom.in
You will see that a file called Diagnostics.pdf has been created in your directory. Opening that PDF, you should see the following two plots:
Review
This was just one simple example of how you can use CAP to manipulate MGCM output data in netCDF files and visualize the results. Going forward, make generous use of cap and <executable name> --help to guide your analysis process. For more use case examples, see _cap_practical.
Additional Information
CAP is developed and maintained by the Mars Climate Modeling Center (MCMC) at NASA’s Ames Research Center in Mountain View, CA. For more information, visit the MCMC website.